Election day: a feast of interactivity

From a European perspective the midterm elections held today in the United States are a feast of democracy. Voters elect new members for the House of Representatives and the Senate and all kinds of local representatives. Furthermore they are able to give their opinion on several ballot measures, initiatives, and propositions.
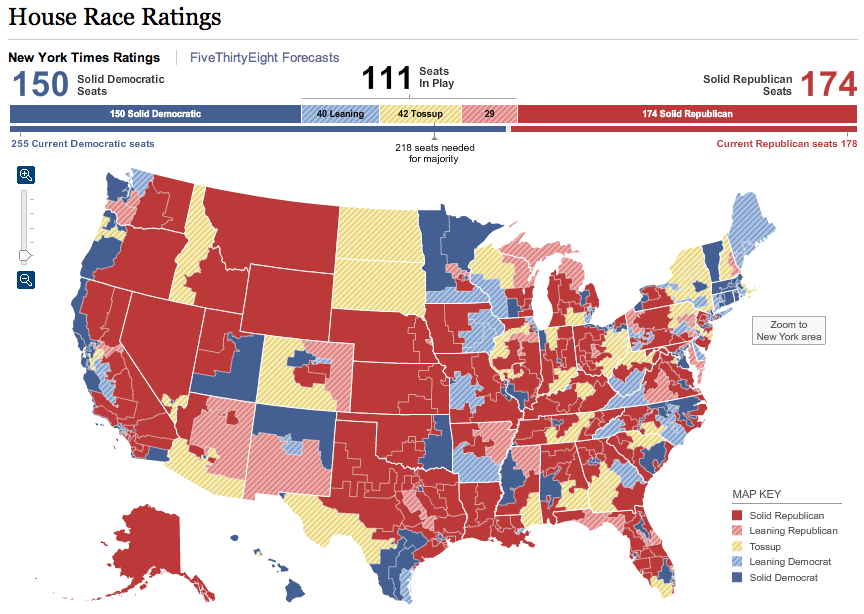
Election day is also a feast of interactivity. As always The New York Times is leading, with interactive election maps for the House and Senate, a visualization of political tweets and an overview of states where Tea Party candidates are running.
But of course others show their best too. Good visualizes how the political climate has changed over time while Forbes concentrates on billionaires’ favorite politicians. Pressure groups also have discovered the power of infographics. Oil Change International reveals how energy companies attempt to suspend the California Global Warming Act by funding Proposition 23. A nice example of the power of zoom, except for the counterintuitive slider. Less interactive but much funnier is this explanimation that promotes the legalization and taxing of cannabis in that same state: