Looking forward to the Infographics Creation Tool
Visual.ly is a nice website that collects examples of data visualizations. But it’s also a company that is building a tool that promises you to easily create sophisticated (interactive) infographics. In the Eager Eyes of Robert Kosara this tool holds no less then The Future of Data-Based Infographics. Read his crystal clear post and you can only agree:
The key difference between visualization and infographics is that the former is easy to automate and generic, while the latter are specific and usually hand-drawn. Now imagine a better way to create infographics based on data: a way that lets designers work with numbers more easily to create graphics that are visually exciting while still true to the data; a way that encourages and embodies best practices in visualization for designers. That’s Visual.ly.
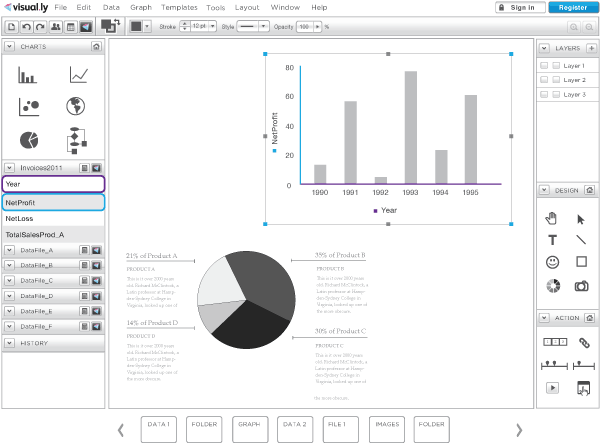
The image below shows a mock-up of the tool. Note the Action palette at the bottom right. I, for one, am really looking forward to a working demo!
