Not so interactive slideshow

In their article Narrative Visualization: Telling Stories with Data (pdf) – that I found thanks to this must-see interactive movie about data journalism – Edward Segel and Jeffrey Heer define 7 basic genres of narrative visualization (magazine style, annotated chart, partitioned poster, flow chart, comic strip, slideshow, and film/video/animation) and three schemas that are widely used to tell stories with (visual) data:
- The Martini Glass structure; a linear narrative that only allows user interaction when the story is finished,
- The Drill-Down Story; a presentation that lets the user dictate what stories are told and when, without a prescribed ordering.
- The Interactive Slideshow; a regular slideshow that incorporates interaction on its slides.
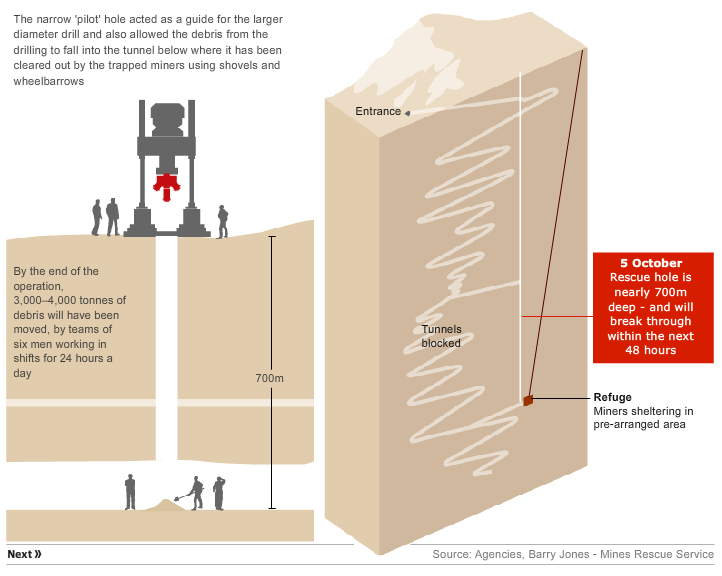
That last model obviously was what The Guardian had in mind when it decided to create an interactive about the trapped miners in Chili. A good idea, but the implementation is a bit sloppy. It’s for example easy to miss the tiny ‘next’ button at the bottom because the slideshow hardly fits on the screen of a laptop. The slides are heavy loaded with text but miss headings that guide you through the story. And isn’t a ‘back’ button a basic requirement for an interactive slideshow?