Stress and distraction
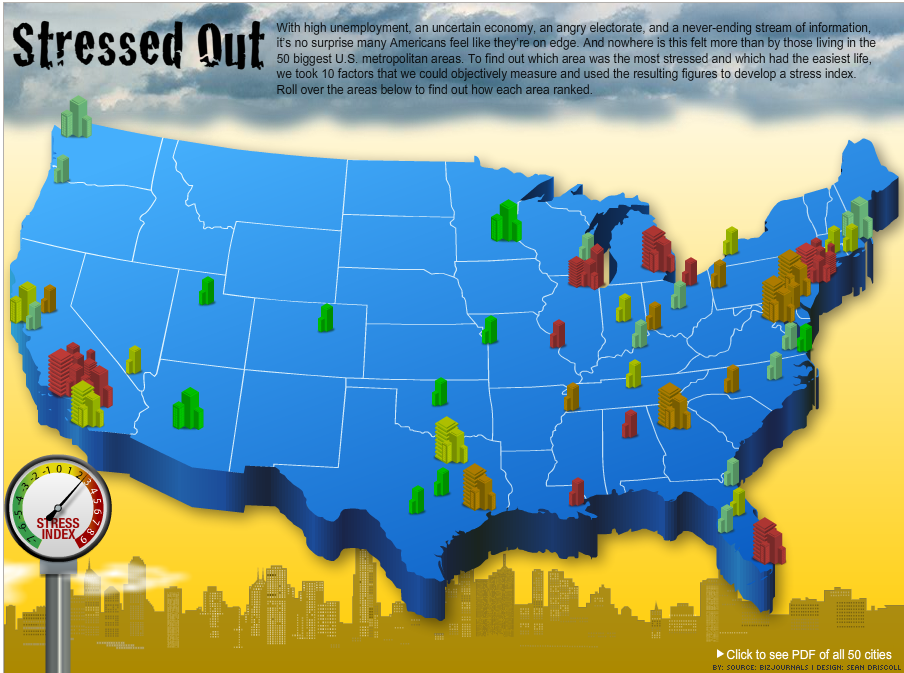
 Financial website Portfolio.com made
an inventory of
factors that can increase stress in metro areas, ranging from unemployment and traffic to
pollution and even the weather. These were quantified for the 50 largest cities in the States.
The results are visualized on an interactive
map. A good idea but the implementation could have been better. For one thing I would have liked
to be able to compare the areas on each individual factor. Secondly I prefer a click instead of
a mouse-over to reveal popup windows. Last but not least, the animation of the steam
doesn’t contain information but certainly adds distraction.