So much beautiful knowledge for free
 Like most research the study of interactive infographics is
interdisciplinary. I try to mix
concepts and ideas from different fields ranging from communication theory to information
visualization and cognitive psychology.
Obviously, interaction design is also high on the list. I don't have any background in this field, so I'm very glad with Interaction-Design.org. The encyclopedia (actually it's more like a textbook) at this website is a welcome introduction to the world of Human Computer Interaction and User Experience. For me, the chapters about Visual Representation (written by Alan Blackwell), Data Visualization (by Stephen Few), and the Philosophy of Interaction (Dag Svanaes) are also very relevant. For who wants to go more in depth, the site features a huge bibliography with references from all the relevant conferences on interaction design and adjacent fields.
But not only the newest insights are available online. Dustin Smith today links to some amazing books about data visualization from before the era of the computer. Among these works, that are made digital available by The Internet Archive, are two books by Willard Cope Brinton: Graphic Methods for Presenting Facts (1914) and Graphic Presentation (1939).
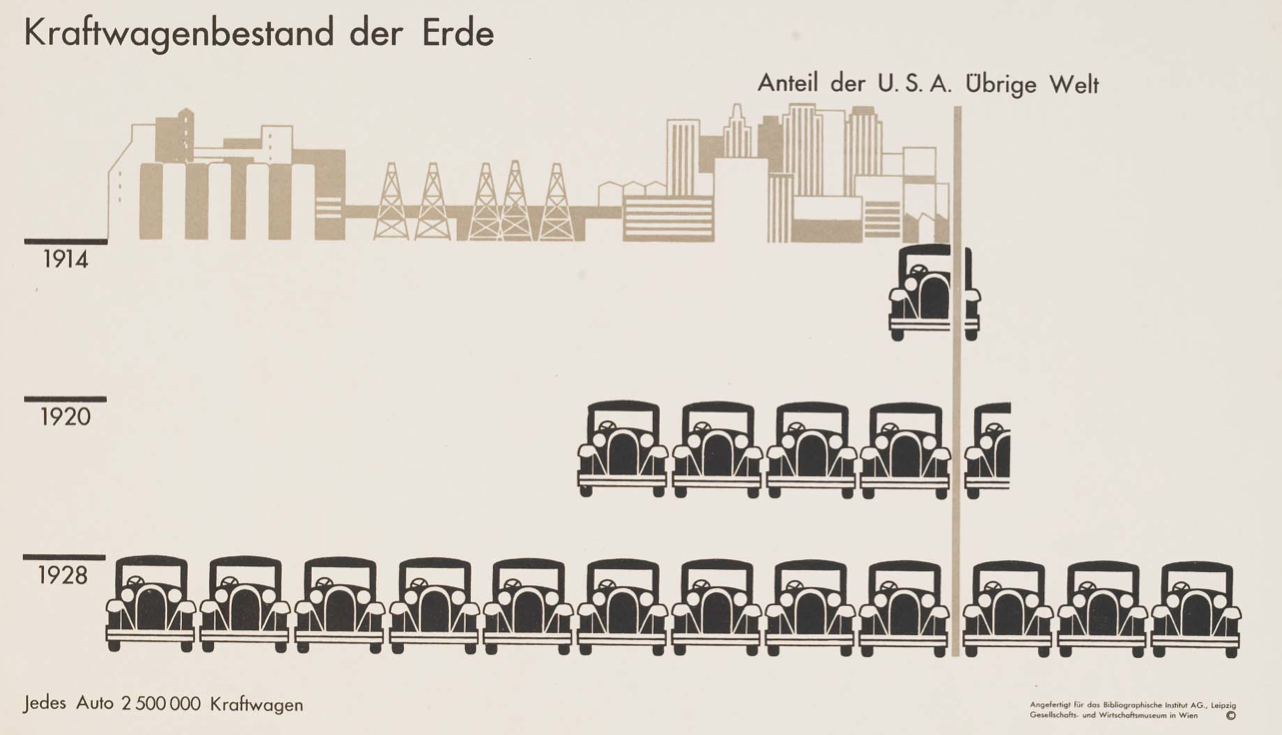
I would like to add the digitized work of Otto Neurath, the creator of Isotype. For me, this ‘picture language' is the starting point of modern infographic design. Some of Neurath's best work, including the Atlas Gesellschaft und Wirtschaft (1931) and International picture language. The first rules of Isotype (1936) is available in pdf. We are privileged to live in times that offer so much beautiful knowledge for free.
